# Names of required packages
packages <- c(
  "dplyr",
  "ggplot2",
  "gt",
  "here",
  "lubridate",
  "remotes",
  "reshape2",
  "shinystan",
  "tidyr",
  "TMB"
)

# Install packages not yet installed
installed_packages <- packages %in% rownames(installed.packages())
if (any(installed_packages == FALSE)) {
  install.packages(packages[!installed_packages], repos = "http://cran.us.r-project.org")
}

# the Bayesian case study requires these extra packages
if (!"StanEstimators" %in% rownames(installed.packages())) {
  install.packages("StanEstimators", repos = c("https://andrjohns.r-universe.dev", "https://cloud.r-project.org"))
}

if (!"adnuts" %in% rownames(installed.packages())) {
  remotes::install_github("Cole-Monnahan-NOAA/adnuts")
}

# SS3 case studies require r4ss
if (!"r4ss" %in% rownames(installed.packages())) {
  remotes::install_github("r4ss/r4ss")
}

# Install FIMS: main branch version if on main, dev version on any other branch

branch_name <- system("git branch --show-current", intern = TRUE)
use_fims_main <- grepl("main", branch_name)

if (use_fims_main) {
  remotes::install_github("NOAA-FIMS/FIMS")
} else {
  remotes::install_github("NOAA-FIMS/FIMS", ref = "dev")
}

# Load packages
invisible(lapply(packages, library, character.only = TRUE))

library(FIMS)
library(adnuts)
R_version <- version$version.string
TMB_version <- packageDescription("TMB")$Version
FIMS_commit <- substr(packageDescription("FIMS")$GithubSHA1, 1, 7)

source(file.path("R", "utils.R"))Opakapaka Case Study
#remotes::install_github("NOAA-FIMS/FIMS", ref = "main")
library(r4ss)
# clear memory
clear()
The setup
- R version =
R_version - TMB version =
TMB_version - FIMS commit =
FIMS_commit r4ssversion =r4ss_version
- Stock name: Main Hawaiian Islands Opakapaka
- Region: Pacific Islands
- Analyst: Meg Oshima
Setting up Data
load(here::here("content", "data_files", "opaka_model.RDS"))
include_age_comps <- FALSE
years <- seq(opaka_dat$styr, opaka_dat$endyr)
nyears <- length(years) # the number of years which we have data for.
nseasons <- 1 # the number of seasons in each year. FIMS currently defaults to 1
ages <- seq(1, 21) # age vector.
nages <- length(ages) # the number of age groups.
comp_lengths <- opaka_dat$lbin_vector # length vector.
nlengths <- length(comp_lengths) # the number of length bins.
Preparing Data using FIMSFrame
We will be reading data into the model using the FIMSFrame S4 R class set up in R/fimsframe.R
# use FIMS data frame

source(here::here("content", "R", "get_ss3_data.R"))
opaka_dat_fims <- get_ss3_data(opaka_dat, fleets = c(1,2,3), ages = ages, lengths = comp_lengths)

opaka_dat_fims <- opaka_dat_fims |>
  dplyr::filter(type != "age")
## age to length conversion matrix
# Growth function values to create age to length conversion matrix from model
#comparison project
mg_pars <- rep$parameters  |>
dplyr::filter(stringr::str_detect(Label, "_GP_"))
Linf <- mg_pars$Value[3]
K <- mg_pars$Value[4]
a0 <- -0.29
amax <- 21
cv <- mg_pars$Value[5]

L2Wa <- mg_pars$Value[7]
L2Wb <- mg_pars$Value[8]

AtoL <- function(a,Linf,K,a_0){
  L <- Linf*(1-exp(-K*(a-a_0)))
  }

ages <- 1:amax
len_bins <- comp_lengths

#Create length at age conversion matrix and fill proportions using above
#growth parameters
length_age_conversion <- matrix(NA,nrow=length(ages),ncol=length(len_bins))
for(i in seq_along(ages)){
  #Calculate mean length at age to spread lengths around
  mean_length <- AtoL(ages[i],Linf,K,a0)
  #mean_length <- AtoLSchnute(ages[i],L1,L2,a1,a2,Ks)
  #Calculate the cumulative proportion shorter than each composition length
  temp_len_probs<-pnorm(q=len_bins,mean=mean_length,sd=mean_length*cv)
  #Reset the first length proportion to zero so the first bin includes all
  #density smaller than that bin
  temp_len_probs[1]<-0
  #subtract the offset length probabilities to calculate the proportion in each
  #bin. For each length bin the proportion is how many fish are larger than this
  #length but shorter than the next bin length.
  temp_len_probs <- c(temp_len_probs[-1],1)-temp_len_probs
  length_age_conversion[i,] <- temp_len_probs
}
colnames(length_age_conversion) <- len_bins
rownames(length_age_conversion) <- ages

#Extract years and fleets from milestone 1 data
start_date <- unique(opaka_dat_fims$datestart[opaka_dat_fims$type=="landings"])
end_date <- unique(opaka_dat_fims$dateend[opaka_dat_fims$type=="landings"])
observers <- unique(opaka_dat_fims$name[opaka_dat_fims$type=="length"])

#Create data frame for new fleet and year specific length at age conversion proportions
length_age_data <- data.frame(
  type = rep("age-to-length-conversion",length(len_bins)*length(ages)*length(observers)*length(start_date)),
  name = rep(sort(rep(observers,length(len_bins)*length(ages))),length(start_date)),
  age = rep(sort(rep(ages,length(len_bins))),length(observers)*length(start_date)),
  length = rep(len_bins,length(ages)*length(observers)*length(start_date)),
  datestart = rep(start_date,each=length(len_bins)*length(ages)*length(observers)),
  dateend = rep(end_date,each=length(len_bins)*length(ages)*length(observers)),
  value = rep(c(t(length_age_conversion)),length(observers)*length(start_date)),
  unit = rep("proportion",length(len_bins)*length(ages)*length(observers)*length(start_date)),
  uncertainty = rep(30,length(len_bins)*length(ages)*length(observers)*length(start_date)))

# Changing the CPUE indices for fleet1 to be a new fleet, fleet4. This helps with model convergence and fitting as it is the longest time series of data available along with the landings.
opaka_dat_fims <- opaka_dat_fims |>
  dplyr::mutate(name = ifelse(name == "fleet1" & type == "index", "fleet4", name))

opaka_dat_fims <- type.convert(
  rbind(opaka_dat_fims, length_age_data),
  as.is = TRUE
)

# Get weight-at-age from SS3 report output and convert from kg to mt
weight_at_age_data <- rep[["wtatage"]] |>
  dplyr::filter(sex == 1 & fleet == 1 & year == 1949) |>
  dplyr::select(dplyr::matches("[0-9]+")) |>
  round(4) |>
  tidyr::pivot_longer(names_to = "age", cols = dplyr::everything()) |>
  dplyr::filter(age %in% ages) |>
  tidyr::expand_grid(
    opaka_dat_fims |> dplyr::select(datestart) |> dplyr::distinct()
  ) |>
  dplyr::left_join(
    opaka_dat_fims |> dplyr::select(datestart, dateend) |> dplyr::distinct(),
    by = "datestart"
  ) |>
  dplyr::mutate(
    type = "weight-at-age",
    name = "fleet1",
    unit = "mt",
    age = as.integer(age),
    value = value/1000
  )
opaka_dat_fims <- opaka_dat_fims |>
  dplyr::bind_rows(weight_at_age_data)


opaka_dat_fims <- opaka_dat_fims |>
  dplyr::mutate(uncertainty = ifelse(type == "length" & name == "fleet2" & value != -999, 1, uncertainty)) |>
  dplyr::filter(!(type == "index" & name == "fleet3"))

fims_frame <- FIMSFrame(opaka_dat_fims)
The fims_frame object contains a @data slot that holds a long data frame with: * 2 fleets: commercial fishery (fleet1) and survey (fleet2) * landings for fleet 1 * cpue for fleet 2 * length composition data for fleet 2
Prepare Parameters using create_default_parameters()
# Define fleet specifications for fleet1 and survey1
fleet1 <- list(
  selectivity = list(form = "LogisticSelectivity"),
  data_distribution = c(
    Landings = "DlnormDistribution"
  )
)
fleet2 <- list(
  selectivity = list(form = "LogisticSelectivity"),
  data_distribution = c(
    Index = "DlnormDistribution",
    LengthComp = "DmultinomDistribution"
  )
)
fleet3 <- list(
  selectivity = list(form = "LogisticSelectivity"),
  data_distribution = c(
    Landings = "DlnormDistribution"
  )
)
fleet4 <- list(
  selectivity = list(form = "LogisticSelectivity"),
  data_distribution = c(
    Index = "DlnormDistribution"
  )
)

# Create default parameters
default_parameters <- fims_frame |>
  create_default_parameters(
    fleets = list(fleet1 = fleet1, fleet2 = fleet2, fleet3 = fleet3, fleet4=fleet4)
  )
Modifying parameters
recdevs <- rep$parameters |>
           dplyr::filter(stringr::str_detect(Label, "RecrDev")) |>
           dplyr::select(Label, Value)

init_naa <- (exp(opaka_ctl$SR_parms["SR_LN(R0)", "INIT"]) * 1000) * exp(-(ages - 1) * 0.135)
init_naa[nages] <- init_naa[nages] / 0.135

parameters <- default_parameters |>
  update_parameters(
    modified_parameters = list(
      fleet1 = list(
        Fleet.log_Fmort.value = log(rep$exploitation$FRS),
        LogisticSelectivity.inflection_point.value = 1.81, #used age selex values
        LogisticSelectivity.inflection_point.estimation_type = "constant",
        LogisticSelectivity.slope.value = 4.5, #used age selex values
        LogisticSelectivity.slope.estimation_type = "constant"
      )
    )
  ) |>
    update_parameters(
      modified_parameters = list(
        fleet4 = list(
          LogisticSelectivity.inflection_point.value = 1.81, #used age selex values
          LogisticSelectivity.inflection_point.estimation_type = "constant",
          LogisticSelectivity.slope.value = 4.5, #used age selex values
          LogisticSelectivity.slope.estimation_type = "constant",
          Fleet.log_q.value = -3.90281 #value from SS
        )
      )
    ) |>
    update_parameters(
    modified_parameters = list(
      fleet2 = list(
        LogisticSelectivity.inflection_point.value = 1, #used age selex values
        LogisticSelectivity.inflection_point.estimation_type = "constant",
        LogisticSelectivity.slope.value = 3, #used age selex values
        LogisticSelectivity.slope.estimation_type = "constant",
        Fleet.log_q.value = -4.12772
      )
    )
  ) |>
  update_parameters(
    modified_parameters = list(
      fleet3 = list(
        Fleet.log_Fmort.value = log(rep$exploitation$Non_comm),
        LogisticSelectivity.inflection_point.value = 1.97,
        LogisticSelectivity.inflection_point.estimation_type = "constant",
        LogisticSelectivity.slope.value = 4.5,
        LogisticSelectivity.slope.estimation_type = "constant"
      )
    )
  ) |>
  update_parameters(
    modified_parameters = list(
      recruitment = list(
        BevertonHoltRecruitment.log_rzero.value = opaka_ctl$SR_parms["SR_LN(R0)", "INIT"],
        BevertonHoltRecruitment.log_devs.value = recdevs$Value,
        BevertonHoltRecruitment.logit_steep.value = -log(1.0- 0.76) + log(0.76 - 0.2)
      )
    )
  ) |>
  update_parameters(
    modified_parameters = list(
      maturity = list(
        LogisticMaturity.inflection_point.value = 7, # currently in opaka model in terms of length so guesstimated what it would be for age based on growth
        LogisticMaturity.inflection_point.estimation_type = "constant",
        LogisticMaturity.slope.value = 0.5, #make positive from SS value
        LogisticMaturity.slope.estimation_type = "constant"
      )
    )
  ) |>
  update_parameters(
    modified_parameters = list(
      population = list(
        Population.log_init_naa.value = log(init_naa),
        Population.log_init_naa.estimation_type = "constant",
        Population.log_M.value = rep(log(0.135), get_n_years(fims_frame)*get_n_ages(fims_frame))
      )
    )
  )
Initialize modules and fit the model
With data and parameters in place, we can now initialize modules using initialize_fims() and fit the model using fit_fims().
# Run the model without optimization to help ensure a viable model
test_fit <- parameters |>
  initialize_fims(data = fims_frame) |>
  fit_fims(optimize = FALSE)

# Run the  model with optimization
fit <- parameters |>
  initialize_fims(data = fims_frame) |>
  fit_fims(optimize = TRUE)
✔ Starting optimization ...
ℹ Restarting optimizer 3 times to improve gradient.
ℹ Maximum gradient went from 0.01229 to 0.00171 after 3 steps.
✔ Finished optimization
✔ Finished sdreport
ℹ FIMS model version: 0.6.3
ℹ Total run time was 3.29849 minutes
ℹ Number of parameters: total=227, fixed_effects=227, and random_effects=0
ℹ Maximum gradient= 0.00171
ℹ Negative log likelihood (NLL):
• Marginal NLL= 569.48717
• Total NLL= 569.48717
ℹ Terminal SB= 1092.39328Problems and Questions:
- In our model maturity and selectivity are length-based processes so I converted (aka eye-balled logistic curves that look like they match for ages) to values that I think would be roughly equivalent in ages. Eventually, having length-based processes would be necessary for this model.
- The scale of the fitted CPUE is lower than the observed values.
- If I don’t fix the initial numbers-at-age, the model puts a really large number of individuals in age-0 bin and then 0 fish in the rest of the ages. Not sure what is happening here.
Plotting Results
index_results <- data.frame(
  observed = m_index(fims_frame, "fleet2"),
  expected = get_report(fit)[["index_exp"]][[2]]
) |>
dplyr::mutate(year = years) |>
dplyr::filter(year > 2016)
#print(index_results)

ggplot2::ggplot(index_results, ggplot2::aes(x = year, y = observed)) +
  ggplot2::geom_point() +
  ggplot2::xlab("Year") +
  ggplot2::ylab("Index (mt)") +
  ggplot2::geom_line(ggplot2::aes(x = year, y = expected), color = "blue") +
  ggplot2::theme_bw()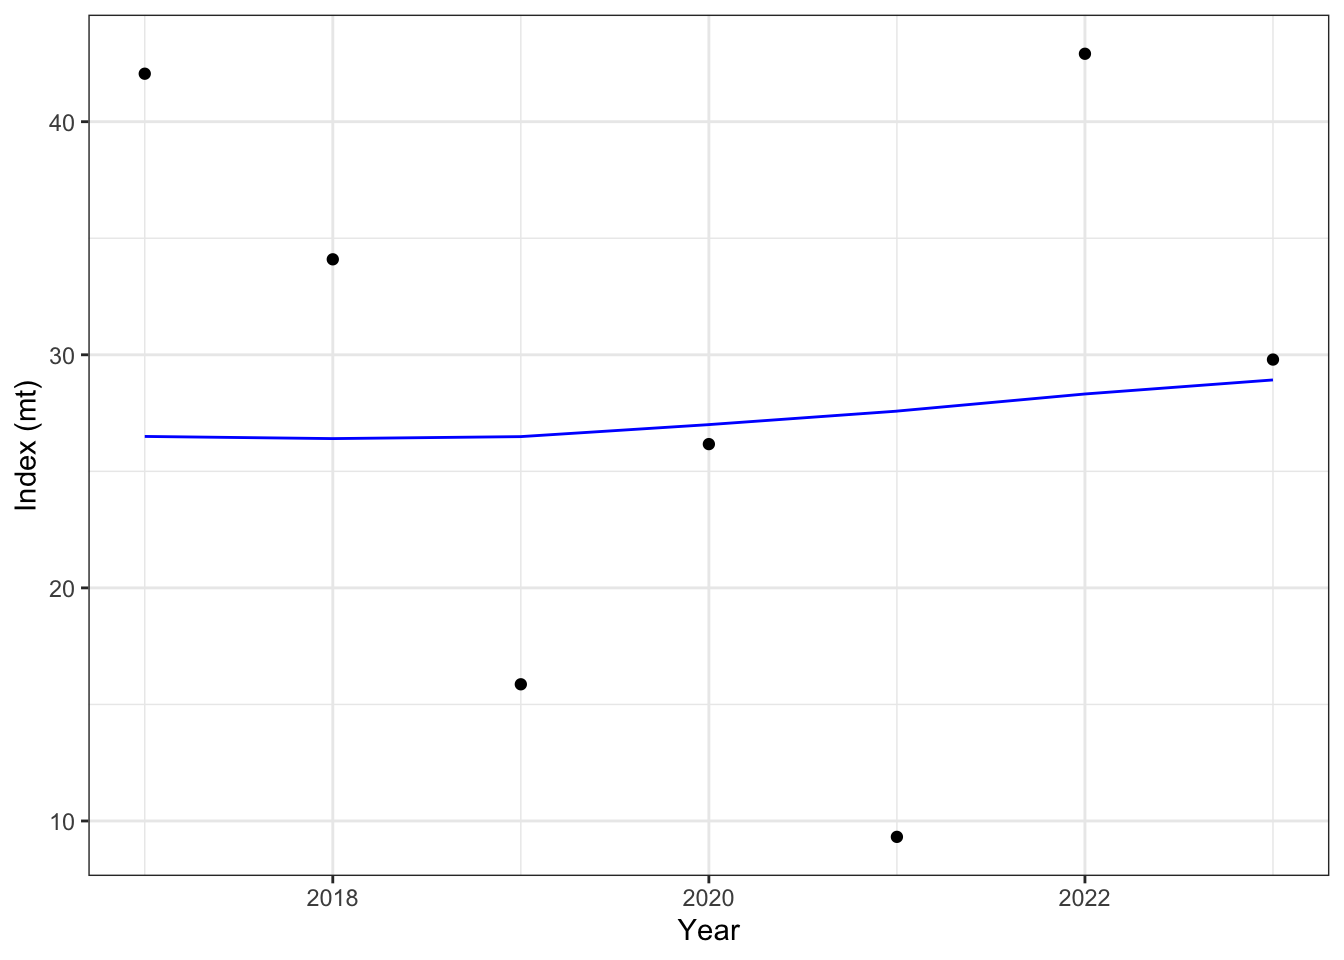
cpue_results <- data.frame(
  observed = m_index(fims_frame, "fleet4"),
  expected = get_report(fit)[["index_exp"]][[2]]
) |>
dplyr::mutate(year = years) |>
dplyr::filter(observed >0)
#print(cpue_results)
ggplot2::ggplot(cpue_results, ggplot2::aes(x = year, y = observed)) +
  ggplot2::geom_point() +
  ggplot2::xlab("Year") +
  ggplot2::ylab("CPUE") +
  ggplot2::geom_line(ggplot2::aes(x = year, y = expected), color = "blue") +
  ggplot2::theme_bw()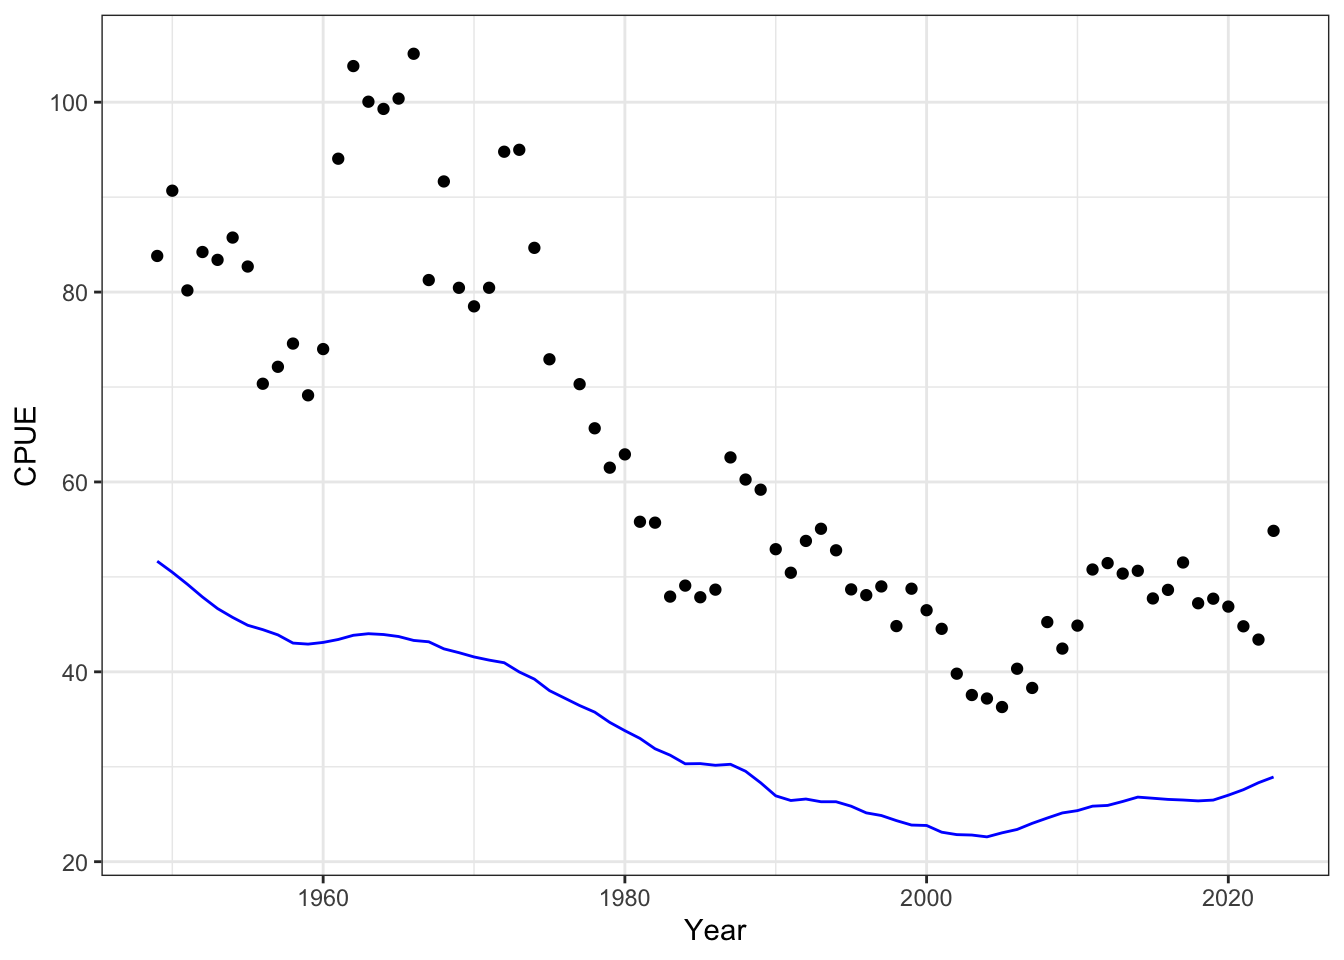
catch_results <- data.frame(
  observed = c(m_landings(fims_frame, fleet = "fleet1"), m_landings(fims_frame, fleet = "fleet3")),
  expected = c(get_report(fit)[["landings_exp"]][[1]], get_report(fit)[["landings_exp"]][[3]]),
  fleet = rep(c("fleet1", "fleet3"), each = 75)
) |>
dplyr::mutate(year = rep(years, 2))
#print(catch_results)

ggplot2::ggplot(catch_results, ggplot2::aes(x = year, y = observed)) +
  ggplot2::geom_point(ggplot2::aes(color = fleet)) +
  ggplot2::xlab("Year") +
  ggplot2::ylab("Catch (mt)") +
  ggplot2::geom_line(ggplot2::aes(x = year, y = expected, color = fleet)) +
  ggplot2::theme_bw()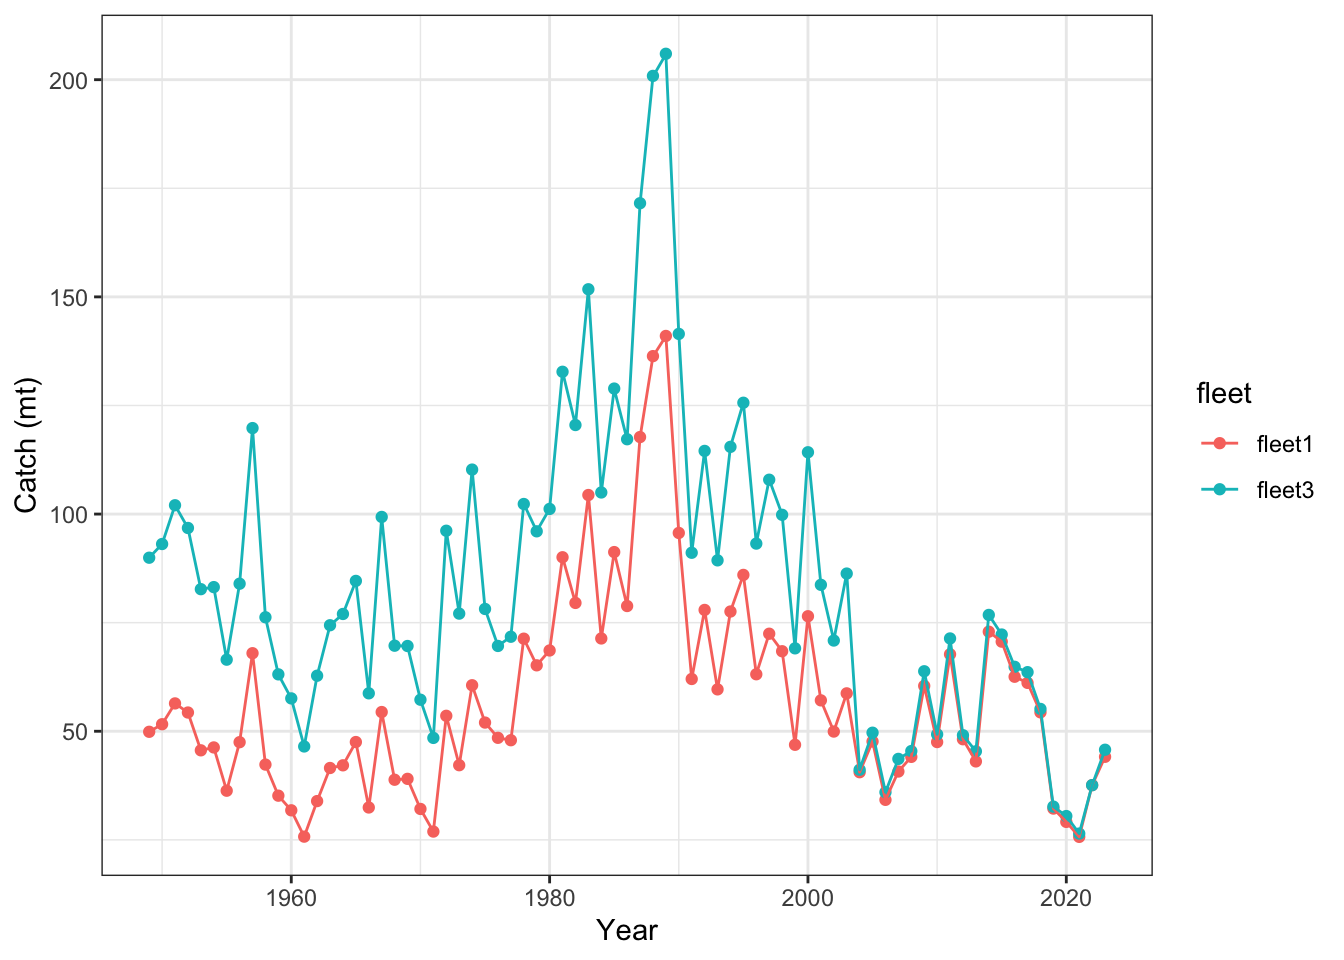
biomass <- rep$timeseries |>
dplyr::select(Yr, SpawnBio, Bio_all) |>
dplyr::filter(Yr > 1947) |> ##CHECK: including "initial year" to match length with FIMS but need to check on FIMS
dplyr::rename("SS_SpawnBio" = "SpawnBio",
              "SS_Bio" = "Bio_all") |>
dplyr::mutate(FIMS_SpawnBio = get_report(fit)[["ssb"]][[1]] ,
              FIMS_Bio = get_report(fit)[["biomass"]][[1]]) |> ##CHECK: Is FIMS ssb reporting nyears+1 or initial year-1?
tidyr::pivot_longer(cols = -Yr) |>
tidyr::separate_wider_delim(cols = "name", delim = "_", names = c("Model", "Type"))

ggplot2::ggplot(biomass, ggplot2::aes(x = Yr, y = value)) +
  ggplot2::geom_line(ggplot2::aes(color = Model)) +
  ggplot2::xlab("Year") +
  ggplot2::ylab("") +
  ggplot2::facet_wrap(~Type, scales = "free_y") +
  ggplot2::theme_bw()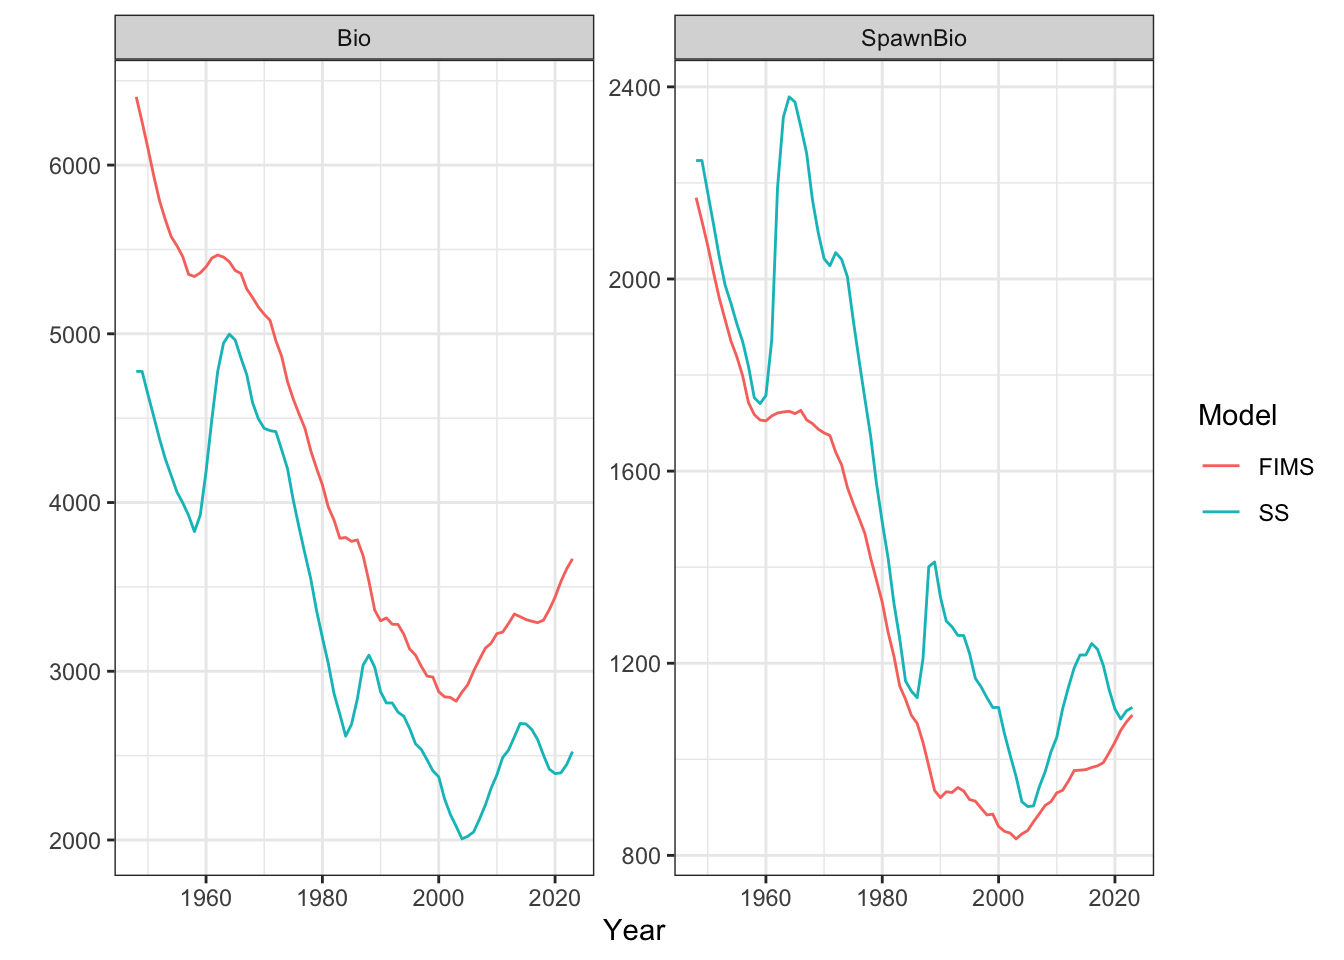
recruits <- rep$recruit |>
  dplyr::select(Yr, exp_recr, raw_dev) |>
  dplyr::rename("SS_recruit" = "exp_recr",
                "SS_recdev" = "raw_dev",
                "Year" = "Yr") |>
  dplyr::mutate(FIMS_recruit = get_report(fit)[["recruitment"]][[1]][1:75],
                FIMS_recdev = c(NA, get_report(fit)[["log_recruit_dev"]][[1]]),
                SS_recruit = SS_recruit * 1000) |>
  tidyr::pivot_longer(cols = -Year) |>
  tidyr::separate_wider_delim(cols = "name", delim = "_", names = c("Model", "Type"))

ggplot2::ggplot(recruits, ggplot2::aes(x = Year, y = value, color = Model)) +
  ggplot2::geom_line() +
  ggplot2::facet_wrap(~Type, scales = "free_y") +
  ggplot2::theme_bw()
Warning: Removed 2 rows containing missing values or values outside the scale range
(`geom_line()`).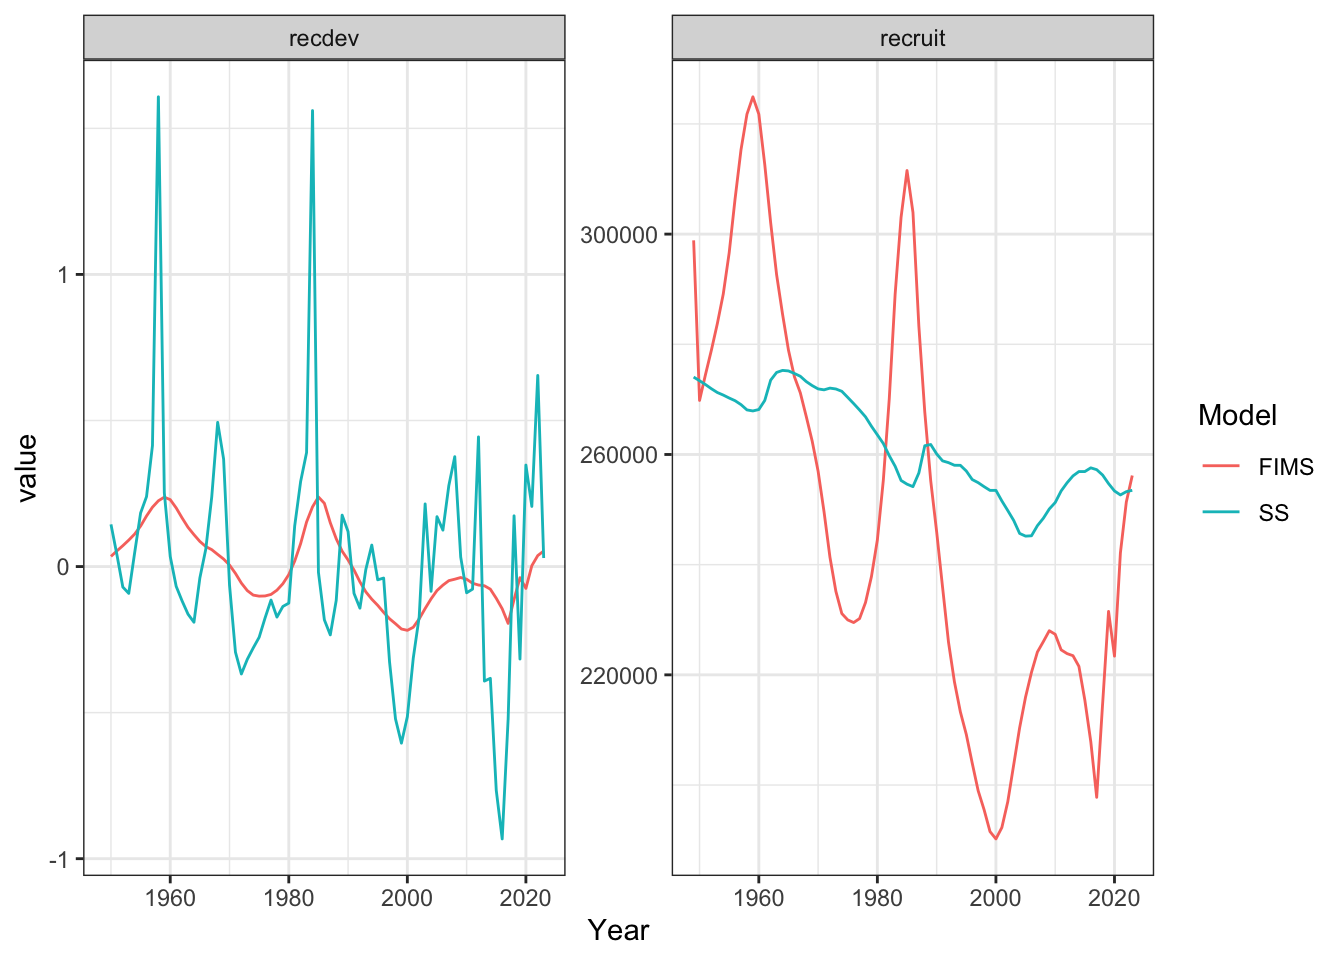
Code
## Checking fit to proportion catch number at length
pcnal <- matrix(data = fit@report$pcnal[[2]], nrow = nlengths)

prop.dat <- opaka_dat_fims |>
filter(type == "length" & name == "fleet2") |>
group_by(datestart) |>
reframe(prop = value/sum(value))
pcnal.obs <- matrix(data = prop.dat$prop, nrow = nlengths)
head(pcnal.obs)

plot(x = 1:nlengths, y = pcnal.obs[,73], pch = 16,  ylim = c(0,1))
lines(x = 1:nlengths, y = pcnal[,73])
pcnal[,69]

## checking estimated numbers at age
head(fit@report$naa[[1]])
naa_mat <- matrix(data = fit@report$naa[[1]], nrow = nages)
head(naa_mat)